
1. The US is a death trap due to permissive gun laws and high gun ownership per capita.
It is possible to “prove” this by hand-picking data. However, if you look at a complete data set there is no correlation between gun laws/gun ownership and death rate (murder rate). The anti-gunners play fast and loose with equating dissimilar statistics and leaving out data that don't fit their agenda. The Crime Prevention Research Center (CPRC) has a good breakdown of this issue, but most people on the left will dismiss the data because the CPRC is "pro-gun."
The claim itself comes from a number of places, one of which is Bloomberg (N.B. Michael Bloomberg pledged $50,000,000 of his fortune to promoting anti-gun legislation last year, but that's a topic for another post as well). According to Bloomberg, “it's safe to say that more guns make for more bodies.”
Let's look more closely at the data. The survey used the Small Arms Survey, which only counted the number of privately owned guns. So the number of guns per capita are underrepresented for countries like Israel and Switzerland (where all able bodied men between 18 and 42 have military weapons in their homes).
Another issue affecting gun counts is that the survey counted the number of privately owned guns. A collector who owns 200 guns is no more “dangerous” than someone who owns one gun. In many of the countries on the list citizens are limited to owning one gun. In the US, because of the purchasing power of our citizens, and due to the fact that guns last a very long time, the average gun owner has multiple firearms. A better number would be to count the number of people who have guns rather than the number of guns. In the US that would take the number from 300 million (guns) to about 110 million (people).
Even using the entire data set as-is, there is no correlation between gun ownership rates and homicide if you include all the countries in the survey (actually the data appear to show the opposite). What Bloomberg (and the NY Times and others) have done is selected a small subset of data to show a trend that isn't there. [see section on how this works]
Their justification for not including all the countries in the data set is that some countries are not “civilized” - so they only included “civilized” countries. Who decides what's a “civilized” country? That's the beauty – you can pick any subset you want.
If you want to be more objective, you could use the definition of “developed” countries according to the Office of Economic Co-operation and Development. Including only that list of countries we still don't see a correlation between gun ownership and homicide rate (or maybe even a negative correlation).
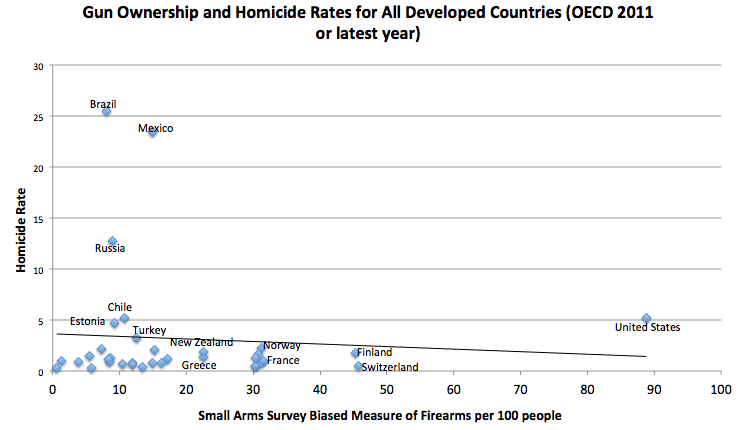
Either way, no honest look at the data shows a correlation between owning more guns and a higher homicide rate (let alone a causal relationship).
But wait, there's more! Not only are the gun numbers in the study poorly represented, the homicide numbers are misrepresented. The reason is that homicides are not uniformly reported across the countries in the study, and the data does not take that into account. Some countries, like the US, record cases of justifiable homicide as homicide, while others do not. Others, like Portugal, lump “cause of death unknown” cases into the homicide figures.
But perhaps the “classic” case of manipulating homicide numbers is the UK. Homicides in England and Wales “exclude any cases which do not result in conviction, or where the person is not prosecuted on grounds of self defense or otherwise” (Report to Parliament).
What would it mean if the US adopted similar recording practices? In 2012, the US murder rate was 4.7 per 100,000, a total of 14,827. Arrests amounted to only 7,133. Using only people who were arrested (not just convicted) would lower the US murder rate to 2.26 per 100,000. More information on the adjustment for England and Wales is available here and it suggests that while many homicides are excluded it isn’t as large as it would appear (in 1997, the downward adjustment would be about 12 percent). Still, it makes the figures of the UK look better than they actually are (making the US look worse by comparison).
Finally from a recent article in the Daily Signal:
A quick look into the facts reveals an entirely different picture. According to the FBI, in the past two decades, violent crime has been falling almost continuously. In 2013, the number of violent crimes perpetrated was 37 percent lower than it was just two decades earlier.
In 1994, there were 23,326 murders in the United States; by 2013, that number had fallen to 14,196, an incredible 39-percent decline. More specifically, according to the Department of Justice, the number of firearm-related homicides declined from 18,253 in 1993 to 11,101 in 2011.
The Department of Justice further concludes that even non-fatal gun-related crimes are declining, dropping 69 percent between 1993 and 2011. While the exact causes for this dramatic decrease can be debated, the decrease itself raises the question: Where does this idea of an “epidemic” of rising gun violence come from?
The notion that the U.S. is suffering from rampant gun violence is simply a fabrication of the media.
To summarize:
-
The data used by
anti-gunners are
“cherry picked” form the data set to appear to support the
desired result.
- If you look at the entire data set, or an objectively chosen subset, there is no correlation between gun ownership and homicide rates across countries.
-
In fact, according to official numbers (FBI etc.) gun violence is down dramatically in the U.S.
How this works

However, suppose I wanted to “prove” that larger numbers on the first die caused the second die to also have larger numbers. All I have to do is carefully pick a subset of the data, and then either not mention that I have chosen a subset, or present a justification as to why not all the data was presented.
In this case I will claim that since there are two dice, only even numbers on the first die are relevant (I know it sounds lame, bear with me).


0 comments:
Post a Comment